Administered Price Reports
Under “All reports”, “Prices” we have added “Administered Pricing – ENERGY” and “Administered Pricing – FCAS”.
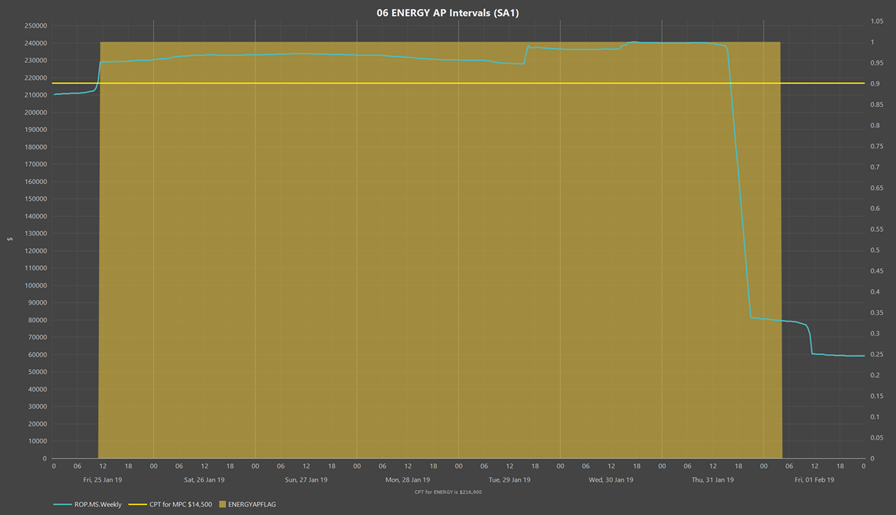
The “Administered Pricing – ENERGY” report shows time intervals for when administered pricing applies in the selected region. This is indicated by ENERGYAPFLAG = 1 and is sourced from the APEVENT and APEVENTREGION tables. The chart also calculates the cumulative trading interval energy price for the selected region over the previous 336 trading intervals (1 week) from the DISPATCHPRICE table. The ROP price capped at the Market Price Cap ($14,500) is used in the calculation. When this value exceeds the Cumulative Price Threshold ($216,900), administered pricing for all services is triggered in the region and remains so while the CPT is exceeded and until the end of that trading day. When triggered, energy prices are bounded by the Administered Price Cap ($300/MWh) and the Administered Floor Price (-APC). The CPT is updated each financial year.
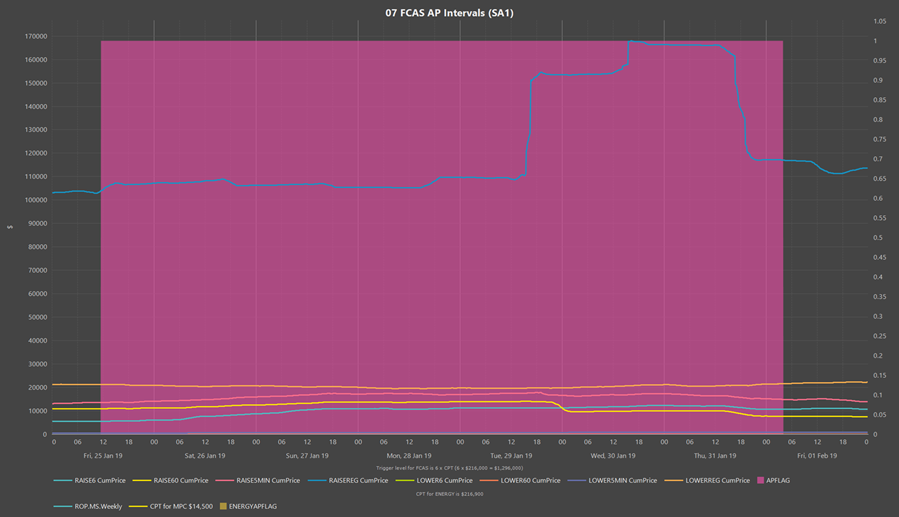
The “Administered Pricing – FCAS” report shows time intervals for when administered pricing applies in the selected region and FCAS service. This is indicated by the service APFLAG = 1 and is sourced from the APEVENT and APEVENTREGION tables. The chart also reports the 5 minute cumulative price for the selected FCAS service from the DISPATCHPRICE table. The cumulative price is for the previous 2016 dispatch intervals (1 week). When this value is 6 x CPT (6 x 216,900 = $1,296,000), administered pricing for all FCAS services is triggered in the region. Note that administered pricing for FCAS services is also triggered if the cumulative energy price for the previous 336 trading intervals exceeds the CPT value.
Settlement Residue Auction Reports
Under “All reports”, “Interconnectors” we have added “SRA Revenue 30 min”, “SRA Revenue 30 min (Calculated) and “SRA Revenue Bar Chart”.
- SRA Revenue 30min is the 30 minute interconnector surplus value based on the surplus value data in the SETIRSURPLUS table for the latest settlement run for the market day. Reports for the revenue in each direction on every regulated interconnector are available.
-
SRA Revenue 30min (Calculated) is the 30 minute interconnector surplus value calculated from the region price data in the TRADINGPRICE table and the interconnector data in the TRADINGINTERCONNECT table.
The surplus is calculated as:
Link surplus ($) = (To region flow * To region price – From region flow * From region price) / 2
Where:- To region flow = Link metered MW flow + From region loss share * Link losses
- From region flow = Link metered MW flow - (1 - From region loss share) * Link losses
Note that this value may differ from the value reported by the SRA Revenue 30min report when the latest settlement run for the market day is not RUNNO 1.
-
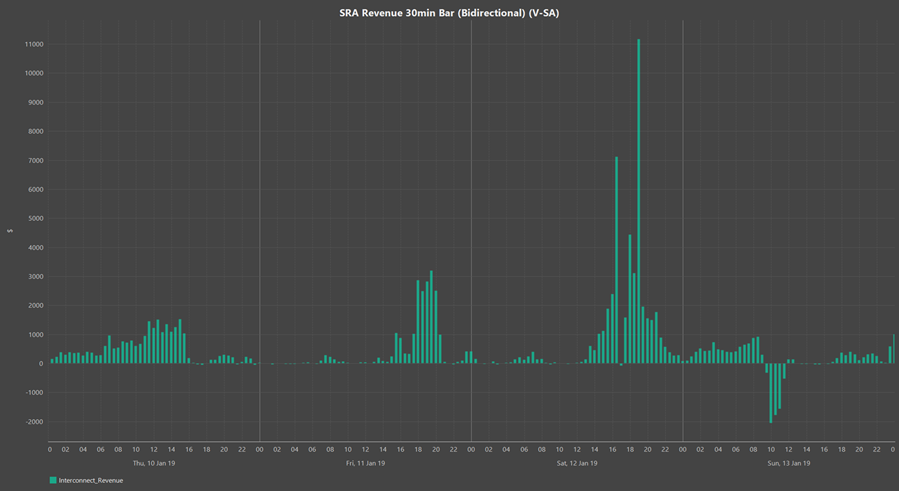
SRA Revenue 5min (Calculated) is the 5 minute interconnector surplus value calculated from the region price data in the TRADINGPRICE table and the interconnector data in the DISPATCHINTERCONNECT table.
The calculation of the surplus value is as for the 30 minute report, except that 5 minute link data is used:
Link surplus ($) = (To region flow * To region price – From region flow * From region price) / 12
The bidirectional version of the above as a bar chart is shown below.
IES provides powerful online tools for electricity and gas market data analysis, visualisation and simulation.
+61 2 9436 2555info@iesys.com
www.iesys.com
DATA ANALYSIS
Products / Services
MARKET MODELLING
Product and features
© 2025 Intelligent Energy Systems. All Rights Reserved. | Privacy Policy