NEOpoint web reporting runs 1000's of electricity, gas and BOM reports in one convenient place.
NEOpoint main features
- Runs in a browser so nothing to install
- Easy to use.
- Unlimited use so all staff can access it at work, home or on mobile devices.
- Data service lets you automate the running of reports and collecting data in other programs like Excel, Matlab, R and Python.
- Interactive dashboard designer lets you create unlimited dashboards each with a customised layout that includes charts or tables
- All reports update within a second of data being updated on the database server but through advanced design there is minimal loading on the server and network bandwidth.
- Its available as a hosted service or if you are a NEO site licencee, you can install the NEOpoint server on your own site.
- As a hosted service it provides access to reports on Australian NEM, STTM, DWGM, and BOM data and covers the full history of the energy market .
- Includes an easy to use Alert system.
Interactive dashboard designer
NEOpoint has a built-in interactive dashboard designer. The RHS of the page can have any number of charts or tables inserted, repositioned and resized. Dashboards can be saved and reloaded. The controls at the left and top of the screen can be hidden leaving the entire screen available for display. All charts and tables and then automatically adjusted for the available screen size. As with all reports shown in NEOpoint, they are updated within a couple of seconds of data being changed on the server. There is no limit to the number of dashboards you can create. They can also be saved as single HTML files on your computer and copied to other computers as fully functioning auto-updating dashboards.
Data services
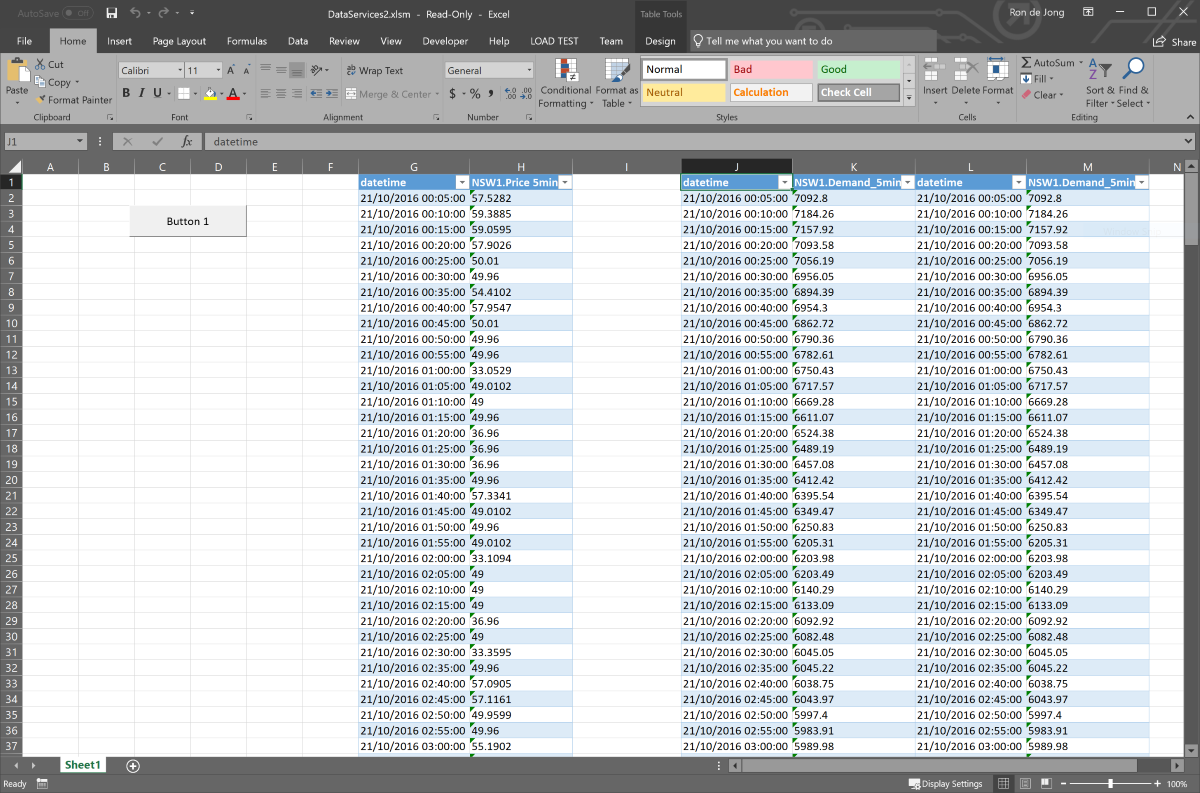
NEOpoint data services allow you to run reports from popular applications like Excel, PowerBI, Matlab, Python and R. It will run a report on request and return in any of the three popular data formats: CSV, JSON, XML.
What this means is that you can fully automate your analyses. Instead of having to manually run reports and copy and paste into Excel for example, you can just run an Excel VBA script to run any number of reports and load them. You don't need to have a browser open or open the NEOpoint website. Your preferred application just makes a web call with a URL that contains the name of the report, start period, report period and any instances (regions, plants etc.) so the URL are easy to manually create or modify in code for different start period for example.
Because it is over the web there is no need for any database drivers so there is nothing to install on your computer.
Mobile
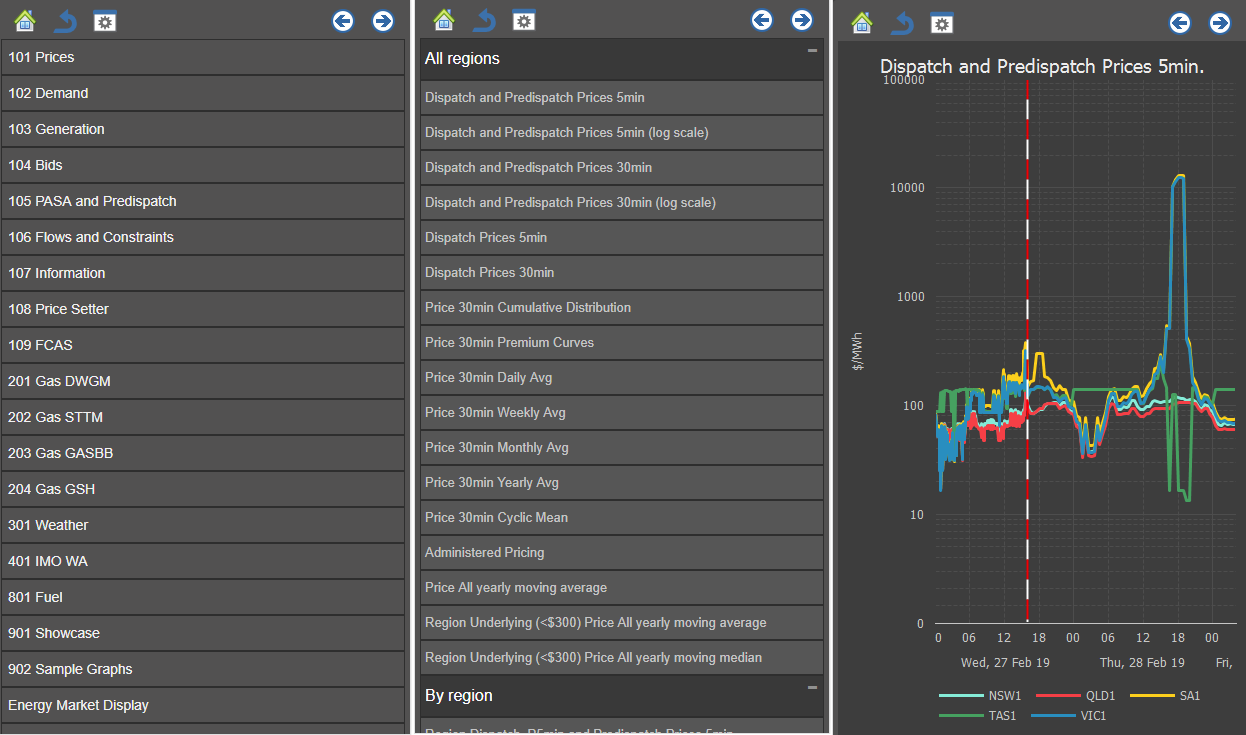
NEOpoint has been specifically designed to look great on desktop, pad or mobile phone. On a mobile you are only two clicks away from any report. Just pick the category like "Price" then the report within that category and the chart appears. The two top right buttons allow viewing data in previous or next contiguous periods. The home button takes you to the top level menu or click the back button to go the the next menu up. The config button allows setting a specific date and period or changing instances like region, plant etc. The display resizes itself for portrait or landscape.
Use your third party tools like Excel, Matlab, R, Python to get data from NEOpoint. More...
Easily create alerts and send notifications either via email or to the NEOpoint mobile app.
All reports update automatically within seconds of new data being available.
Historical data
Access to the full history of energy market data, includes NEM, STTM, VicGas, BOM, etc.
Reports library
You get full access to 1000's of reports and favourites in the IES standard library.
Fast analysis
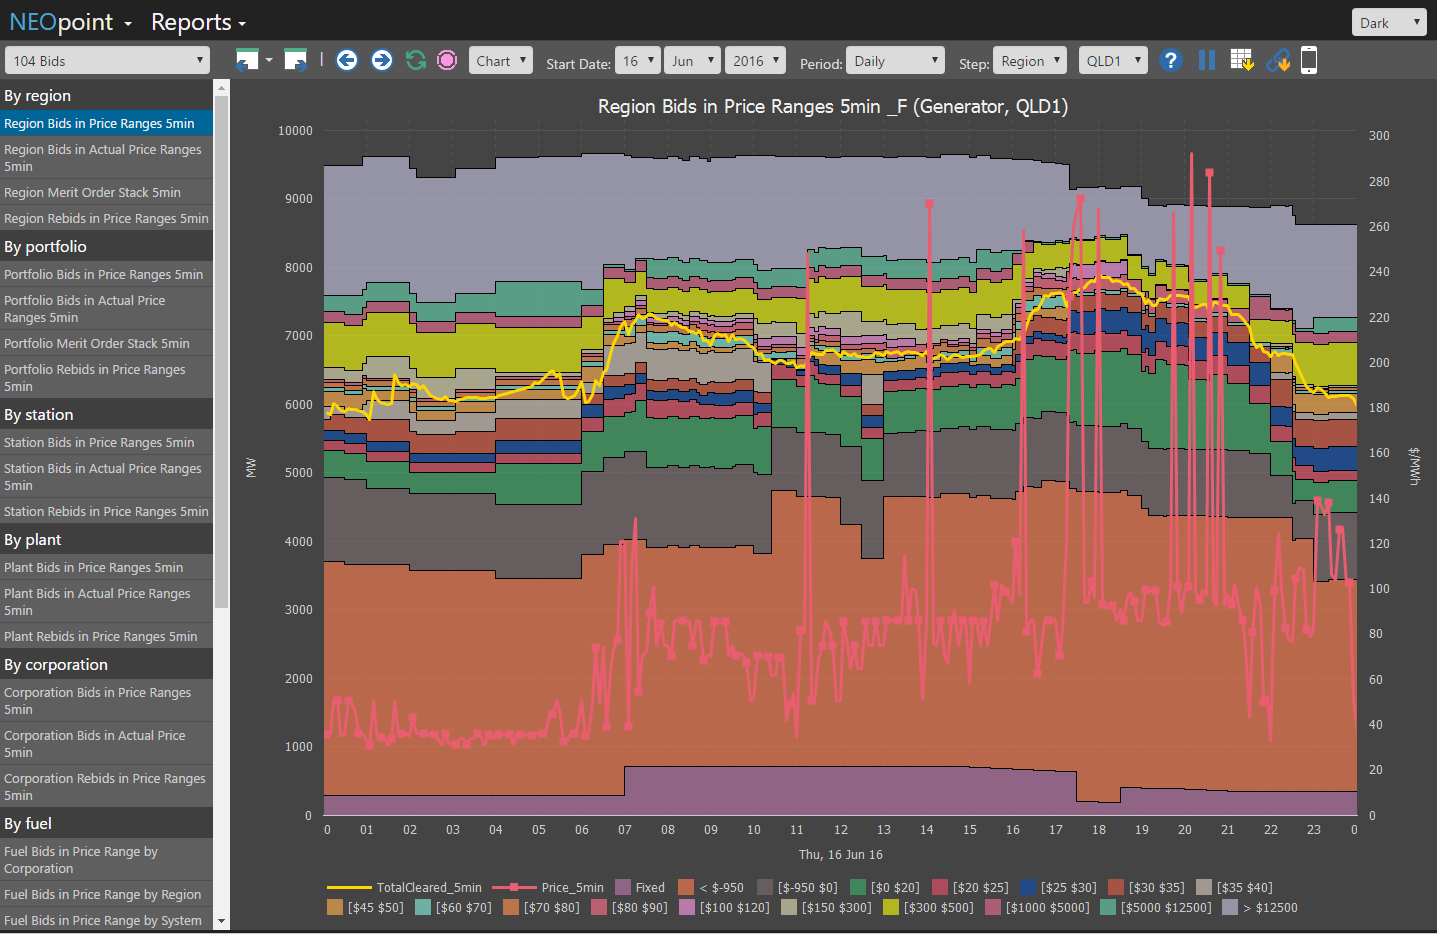
All reports run on performance optimized machines and databases to return data quickly. Bid reports are particularly fast.
Different views
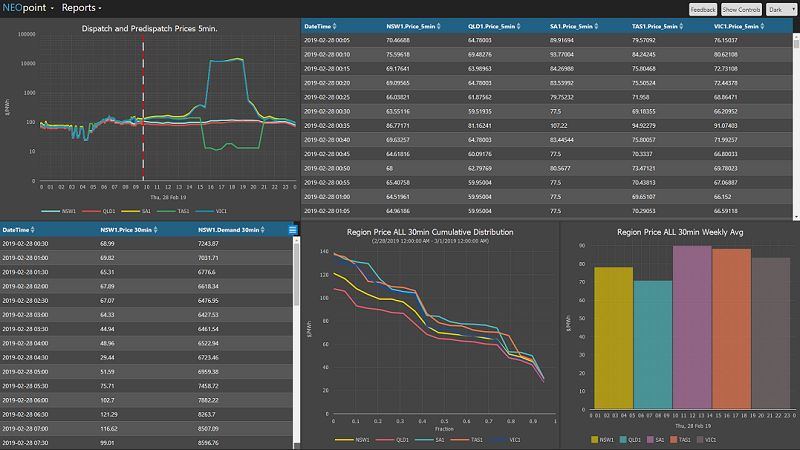
When you run a report, data is returned as charts or tables. You also have the option to download it as a CSV file.
Dashboard designer
You can create dashboards with multiple reports as a mixture of tables and charts using the new interactive dashboard designer.
Learn moreAccess NX favourites
You can also access your own personal NEOexpress favourites from NEOpoint. This means you can create reports and Favourites using NEOexpress and then access them from NEOpoint
Share your reports
You can share reports or results run by you with others by emailing unique URL's. When you send a URL, people viewing that report will see exactly what the originator saw because it uses the results from the originator's run.
History log
NEOpoint maintains a full history of reports run by you, so you can visit them later at any time. All previous report runs within a specified number of months are stored on the server and therefore can be accessed quickly. This also provides an audit trail of all activity.
Performance
NEOpoint is designed to update all reports as fast as possible whilst minimally loading your browser, network and servers. Its advanced technology means that it can easily support hundreds of clients from a single server with low overheads.
Special features
NEOpoint allows you to combine two or more reports in the same chart. The reports can even be at different times so you could e.g. compare a week of demand at two different times.
Responsive design
NEOpoint can be used on any device or browser. Whether it is a mobile phone or a desktop screen NEOpoint has a view specifically designed to make the most of that interface.
Fast switching
Because the server retains the results of all report runs for 30 days (user configurable) you can use the back/forward buttons on the toolbar to quickly flip between the reports you have already run. This also works in mobile mode.
IES provides powerful online tools for electricity and gas market data analysis, visualisation and simulation.
+61 2 9436 2555info@iesys.com
www.iesys.com
DATA ANALYSIS
Products / Services
MARKET MODELLING
Product and features
© 2025 Intelligent Energy Systems. All Rights Reserved. | Privacy Policy