REBID ANALYSIS is an optional module in NEOmobile which we refer to as "Replay". Replay is a view for looking at a single trading day and replaying how the market changes at each 5min dispatch interval including RRP, generation and rebidding.
- View an entire trading day, i.e starting from 4:00am. Complete history since 1 April 2021.
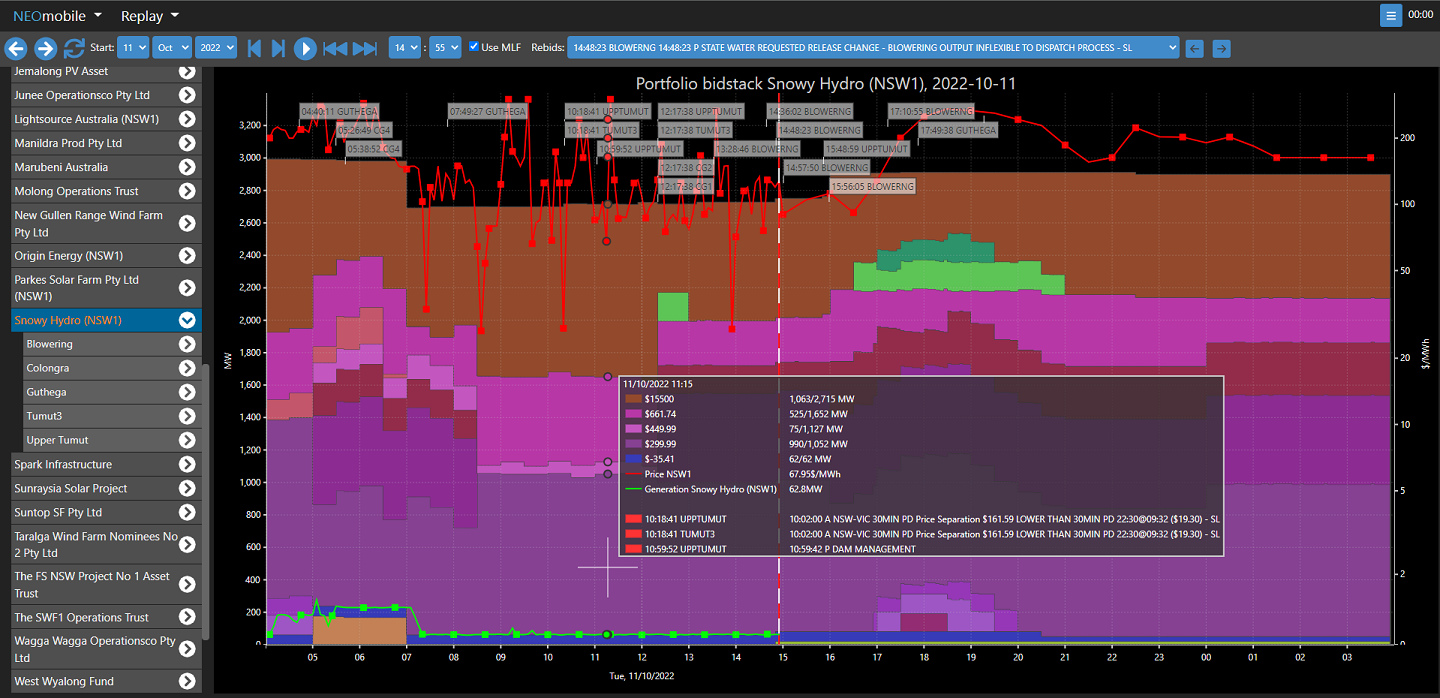
- A "candy cane" cursor shows the current time in the replay. Prices to the left of it are actual 5min price and prices to the right are predispatch. Bids to the left of it are final, bids to the right are bids as they were before rebids with an offerdatetime greater than it (less 5min and margin) are submitted.
- Animate or single step forward or backward through the day. Hold down the jog forward or backward buttons to quickly step through 5min intervals.
- Left hand side has a heirarchical tree of regions, portfolios, stations, plants. Clicking on an instance shows the bid stack for that.
- Data tip on charts shows bidstack prices, quantities, stacked quantities and rebid reasons.
- Rebids are shown as "flags" on the chart that show the DUID and the OFFERDATETIME.
- Optionally apply MLF to bid prices.
- Very fast because all prices, predispatch, and rebids are loaded for all scheduled generators for a single trading day so there is no round tripping to the server to select instances, animate or step.
- As with all NEOmobile charts you can zoom in by clicking the mouse in the top left of the area you want to zoom, then drag and release at the bottom right. Double click to return to normal zoom.
IES provides powerful online tools for electricity and gas market data analysis, visualisation and simulation.
+61 2 9436 2555ies@iesys.com
www.iesys.com
DATA ANALYSIS
Products / Services
MARKET MODELLING
Product and features
© 2024 Intelligent Energy Systems. All Rights Reserved. | Privacy Policy